- Every Journey Needs A Guide
- (971) 865-5158
Smoking Crow – White Paper

Farma – White Paper
February 20, 2019
CBD SEO Case Study
February 21, 2019White Paper
Smoking Crow
At Sherpa we act as our client’s dispensary marketing guide across the growing cannabis industry landscape. With individual states increasingly deciding to legalize marijuana, the landscape is closer to a growing island than an established continent.
Site designs are varied and evolving, branding is still taking root, and there are new competitors arriving on the island every day. A great guide understands the ecosystem. How does a site layout affect visitor actions, to embed a product menu or not, the best way to attract new users to a growing site: all of these choices affect the journey.
We work to make our client’s journey as easy as possible, do the heavy lifting, and keep them safe from dangers like budget hosting, paid backlinks, and private network blogs. A Sherpa doesn’t lead; they inform, they advise, and they guide. Our clients expand their digital marketing knowledge at the same time we expand their business.
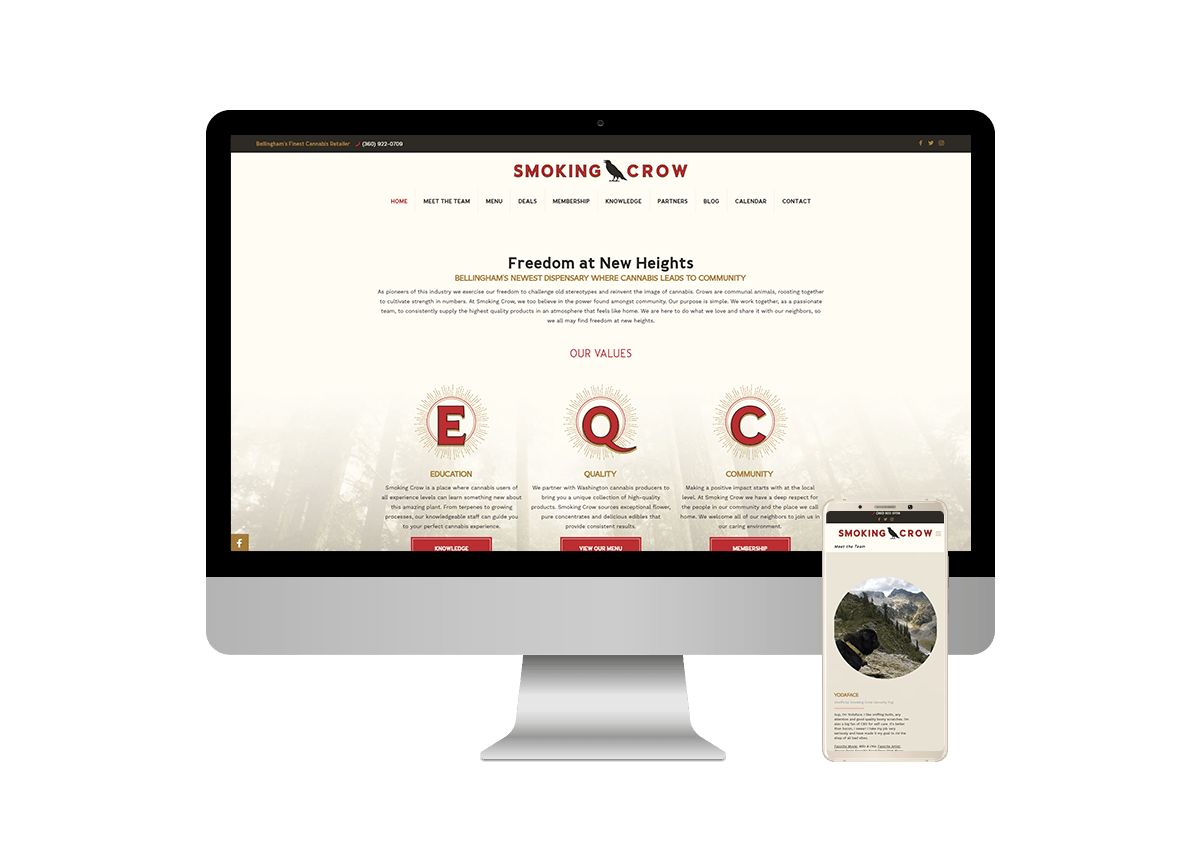
Smoking Crow Overview:
• Opened in 2018
• 1 Location in Washington State
• Medical & Recreational Sales
• Specialties: High-quality cannabis products
• Site Size: 29 Pages
Website Pageviews
Pageview increases between Dec. 2017 and Feb. 2018
Prior to SEO by Sherpa
The site had its initial launch on December 22nd. The first complete optimization was finished on January 9th. As a new site, there isn't historical data to display. This case study shows how Sherpa can grow a new property from a completely blank slate.
After SEO
| Date Range | Total | Unique |
|---|---|---|
| Dec. 21 - Dec. 31 | 268 | 149 |
| Jan. 1 - Jan. 31 | 2,385 | 1,452 |
| Fev. 1 - Feb 20 | 1,660 | 937 |
- Total page views show us how many users visit your site on a monthly basis.
- Unique page views show us how many of those users are new.
296% Increase in total page views month over month.
325% Increase in unique page views month over month.
**Percentage increase based off of 10 day average.**
Why are
pageviews so important?
Page views show us exactly how many visitors spent a single session on the Smoking Crow website. It's a direct metric for the progress a site is making towards customer acquisition.
Page views are influenced by a variety of sources. Because it directly reflects traffic, they can come from organic searches, map searches, and in-bound links from advertising, social media, and citations. In-bound links almost always display as a large jump in traffic before settling down over the course of days or weeks.
The page view graph indicates that Google isn't finished determining where Smoking Crow places among other dispensaries in the Bellingham area. This is evidenced by the large traffic spikes, especially between January 1st and 15th. As Google determines placement, it places a site in different ranking positions to see how users interact with it while comparing this data to other established industry sites in the area.
Keyterm Rankings

27 New terms ranking in the top 50 search results.
5 Existing terms moved into the top 50 search results.

As a site is indexed by different directories and content is added, rankings for keyterms increase.
5 of the original tracked keyterms moved into the top 50 search results over the course of 3 months while 27 term additions did the same.
Customer Acquisition
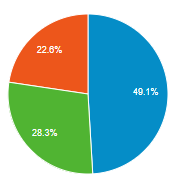
December 21 - 31
| Increase Percentage | Search Type | Site Visits: Dec to Feb |
|---|---|---|
| +288% | Organic Search | 26 to 143 |
| +500% | Direct URL | 15 to 151 |
| -8% | Social Site | 12 to 23 |
| +6900% | Referral Site | 0 to 69 |
| Percentage increase based off 10 day average. | ||
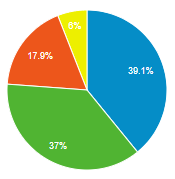
February 1 - 20
Why does the customer acquisition source matter?
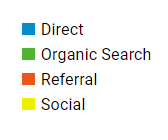
Customer acquisition shows us where traffic came from. They show how different marketing and optimization efforts are molding the online customer base. You can establish a baseline for a client's progress based off of where their site traffic is acquired from. Acquisition is divided into four primary categories:
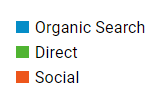
Organic Search: A basic Google search query. Increases in organic search are indicative of search engine optimization. These depend on where Google ranks the site and individual pages after SEO is completed.
Direct URL: A user entering the direct URL into the address bar. Direct traffic shows previous users are revisiting the site directly or new users are entering the URL directly. They often acquire this from business cards or pamphlets.
Social Site: Users coming from Facebook, Instagram, Pinterest, etc. These users are coming off of social media. The stronger the social media presence and better the content, the more social sites will bring in traffic.
Referral Site: Traffic from a site like Leafly, Yelp, etc. This traffic is almost entirely dedicated to incoming users from Citation sites. These may be directories, review sites, or press release links.
Search Listing Improvements
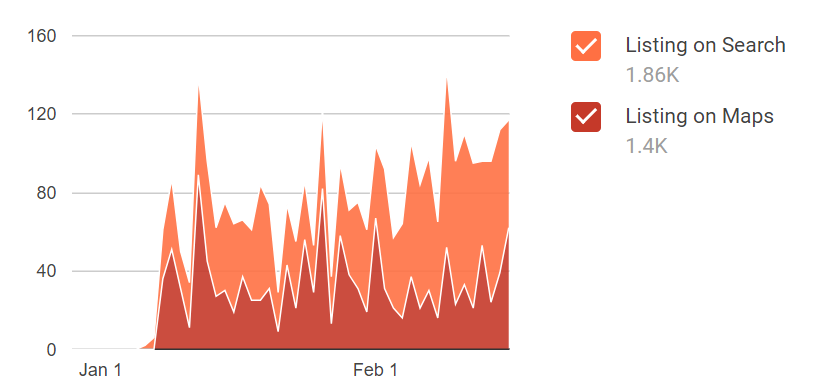
This graph shows us the number of impressions for search (organic) listings and map (Google map) listings. Data is not available prior to January 1st.
100% increase in listings on search between January and February.
While map trends have been scatterd but improving, search listings have seen major upwards movement. Both are trending higher month over month. An upward trend in impressions usually indicates an increase in keyterms and evens out as a website establishes itself.
Website Impression Growth

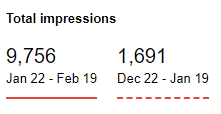
Sherpa achieved a 576% percent increase in the number of impressions between December 22nd and February 10th.
Impressions are a measure of how often one of the pages on your website shows up in a search result. The more impressions, the more search queries your website shows up for.
Summary:
Between December 2017 and February 2018, The Smoking Crow experienced sizable growth in Organic and MAP Listings due to the dispensary SEO efforts of Sherpa.
Growth trends have continued under the guidance of Sherpa.
Search engine optimization from an industry-specialized company can make all the difference for your dispensary. Even with a license cap, dispensaries that do well can purchase the license of a company that has gone under, allowing them to expand an already profitable operation.
If you want to remain competitive and ensure your dispensary never has to sell its license and shutter its doors, SEO by Sherpa is your best tool to capture and convert new customers in the marijuana business landscape.


